Multiple Choice
Identify the letter of the choice that best
completes the statement or answers the question.
|
|
|
1.
|
Linnaeus’s two-word system for naming organisms is called
a. | taxonomic evolution. | c. | Greek polynomials. | b. | Genus species. | d. | binomial
nomenclature. |
|
|
|
2.
|
All scientific names must have
a. | two Latin words. | b. | the same species name. | c. | different genus
names for organisms within the group. | d. | the same common
name. |
|
|
|
3.
|
The basic biological unit in the Linnaean system of classification is the
a. | kingdom. | c. | genus. | b. | family. | d. | species. |
|
|
|
4.
|
An advantage of our scientific naming system is that
a. | common names mean the same in all countries. | b. | Latin names are easy
to pronounce. | c. | biologists can communicate regardless of their native languages. | d. | organisms all have
the same scientific name. |
|
|
|
5.
|
Under the Linnaean system of classification, plants and animals are sorted into
groups based on
a. | number and size. | c. | form and size. | b. | form and structure. | d. | number and
structure. |
|
|
|
6.
|
The largest division that a group of organisms can belong to is
a. | kingdom. | c. | genus. | b. | class. | d. | species. |
|
|
|
7.
|
A group of organisms of different species living together in a particular place
is called a
a. | community. | c. | biome. | b. | population. | d. | habitat. |
|
|
|
8.
|
An ecosystem consists of
a. | a community of organisms. | c. | the soil, water, and
weather. | b. | energy. | d. | All
of the above |
|
|
|
9.
|
A relationship between a producer and consumer is best illustrated by a
a. | snake eating a bird. | c. | lion eating a zebra. | b. | fox eating a mouse. | d. | zebra eating
grass. |
|
|
|
10.
|
Organisms that manufacture organic nutrients for an ecosystem are called
a. | primary consumers. | c. | primary producers. | b. | predators. | d. | scavengers. |
|
|
|
11.
|
The primary producers in a grassland ecosystem would most likely be
a. | insects. | c. | grasses. | b. | bacteria. | d. | algae. |
|
|
|
|
|
|
12.
|
Refer to the illustration above. The photosynthetic algae are
a. | producers. | c. | parasites. | b. | consumers. | d. | decomposers. |
|
|
|
13.
|
Refer to the illustration above. The diagram, which shows how energy moves
through an ecosystem, is known as a
a. | habitat. | c. | food net. | b. | food chain. | d. | food web. |
|
|
|
14.
|
Refer to the illustration above. Leopard seals are
a. | producers. | c. | herbivores. | b. | omnivores. | d. | carnivores. |
|
|
|
15.
|
Refer to the illustration above. Killer whales feed at the
a. | first and second trophic levels. | c. | second and third trophic
levels. | b. | second trophic level only. | d. | third and fourth trophic levels. |
|
|
|
|
|
|
16.
|
Refer to the illustration above. Level A is composed of
a. | carnivores. | c. | producers. | b. | herbivores. | d. | omnivores. |
|
|
|
17.
|
Refer to the illustration above. The diagram shows a(n)
a. | food chain. | c. | food web. | b. | community. | d. | energy pyramid. |
|
|
|
18.
|
Refer to the illustration above. On the pyramid, animals that feed on plant
eaters are no lower than
a. | level A. | c. | level C. | b. | level B. | d. | level D. |
|
|
|
19.
|
Refer to the illustration above. How much energy is available to the organisms
in level C?
a. | all of the energy in level A plus the energy in level B | b. | all of the energy in
level A minus the energy in level B | c. | 10 percent of the energy in level
B | d. | 90 percent of the energy in level B |
|
|
|
20.
|
Precipitation and evaporation are important components of the
a. | nitrogen cycle. | c. | carbon cycle. | b. | water cycle. | d. | All of the
above |
|
|
|
21.
|
The paths of water, carbon, nitrogen, and phosphorus pass from the non-living
environment to living organisms and back to the non-living environment in closed circles
called
a. | living cycles. | c. | biogeochemical cycles. | b. | environcycles. | d. | None of the above |
|
|
|
The diagrams below show different kinds of interactions between
species. 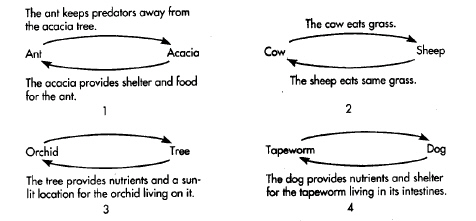
|
|
|
22.
|
Refer to the illustration above. The relationship shown in diagram 4 above
is
a. | commensalism. | c. | mutualism. | b. | competition. | d. | parasitism. |
|
|
|
23.
|
Refer to the illustration above. The relationship shown in diagram 1 above
is
a. | commensalism. | c. | mutualism. | b. | competition. | d. | parasitism. |
|
|
|
24.
|
Refer to the illustration above. The relationship shown in diagram 3 above
is
a. | commensalism. | c. | mutualism. | b. | competition. | d. | parasitism. |
|
|
|
25.
|
Refer to the illustration above. The relationship shown in diagram 2 above
is
a. | commensalism. | c. | mutualism. | b. | competition. | d. | parasitism. |
|